Data Analytics Company
Turn fragmented business data into clear metrics, interactive dashboards, deeper analysis and decision-ready insights. We design analytics around the questions your leadership and teams need to answer.
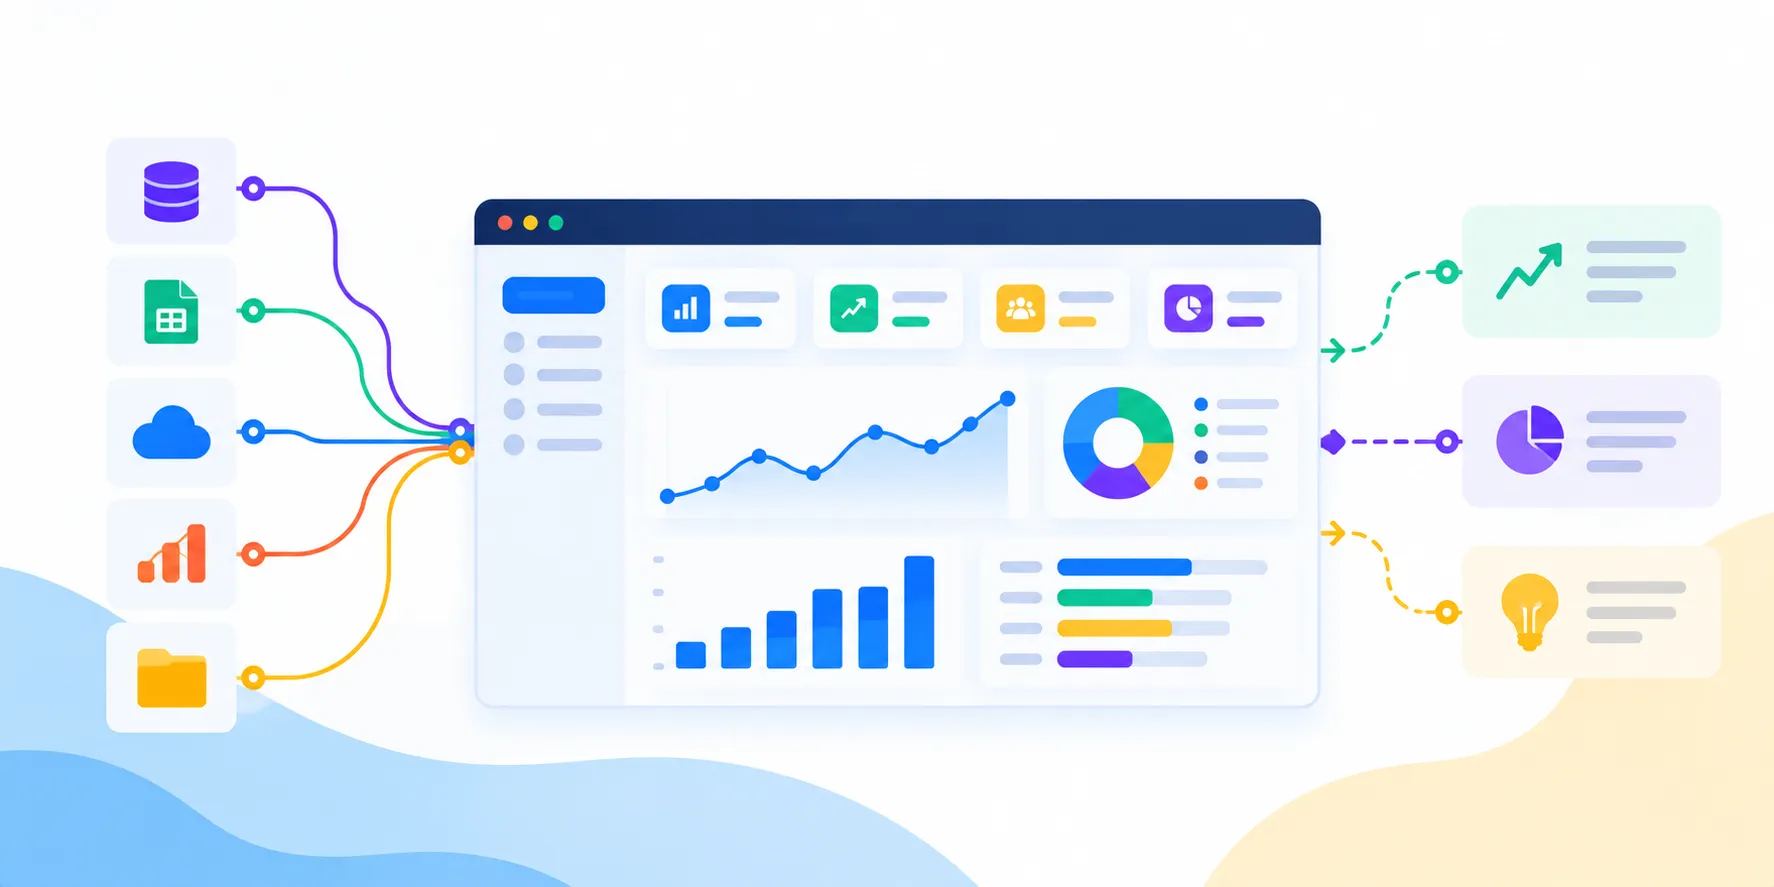
Data Analytics That Connects Numbers to Decisions
Businesses can have large amounts of data and still struggle to answer simple questions: Which products are growing? Where are margins changing? Which customers are at risk? Which marketing channels are producing profitable demand? Where is an operational bottleneck developing?
Our data analytics services turn those questions into measurable metrics, analytical models, dashboards and workflows that help teams understand what is happening and decide what to do next.
We focus on the analytical layer rather than treating a dashboard as the end product. That means defining KPIs, understanding the meaning of each metric, shaping data for analysis, creating useful visual experiences and connecting insights to real business actions.
When the underlying data platform needs significant pipeline or warehouse work, we can work alongside data engineering. When the requirement needs prediction or AI, analytics can extend into advanced modelling and AI-enabled decision support.
Who We Help With Data Analytics
Growing SaaS Companies
Understand acquisition, activation, product usage, retention, subscriptions and revenue across the customer lifecycle.
E-commerce & Retail
Analyse orders, products, inventory, customers, campaigns, margins and fulfillment performance.
Leadership Teams
Create executive scorecards that surface the KPIs, trends, exceptions and opportunities that matter most.
Sales & Marketing Teams
Connect pipeline, conversion, campaign, customer and revenue data for better performance analysis.
Operations Teams
Monitor service levels, capacity, process performance, costs, exceptions and operational trends.
Finance & Business Teams
Build consistent financial, profitability, forecasting and management reporting views.
Data Analytics Services We Offer
From analytics strategy and KPI design to dashboards, advanced analysis and ongoing optimization, our services are shaped around measurable business outcomes.
Data Analytics Consulting
Assess reporting maturity, clarify business questions, identify analytics gaps and define a practical roadmap.
Business Analytics
Translate business goals into metrics, analysis and decision-support workflows across functions.
KPI & Metrics Design
Define formulas, owners, dimensions, targets and consistent measurement rules for critical business metrics.
Dashboard Development
Build executive, operational and departmental dashboards with useful filters, drilldowns and decision paths.
Data Visualization Services
Present complex information through clear visual patterns that help users identify trends, comparisons and exceptions.
Business Intelligence Analytics
Create governed analytical reporting environments that give teams a consistent view of performance.
Predictive Analytics Services
Use historical patterns and appropriate statistical or machine learning methods for forecasting and risk analysis.
Self-Service Analytics
Enable business users to explore governed datasets without creating uncontrolled copies of critical metrics.
Real-Time Analytics
Surface operational events and frequently refreshed KPIs where timely visibility changes the decision.
Customer Analytics
Analyse customer segments, journeys, engagement, retention, churn signals and lifetime value.
Marketing & Sales Analytics
Measure acquisition, campaign performance, pipeline movement, conversion and revenue contribution.
Operational & Financial Analytics
Analyse cost, productivity, capacity, profitability, service performance and operational efficiency.
Embedded Analytics
Bring reporting and analytical experiences directly into SaaS products, portals or internal applications.
Analytics Modernization
Modernize legacy reports, duplicated dashboards and disconnected analytical workflows around current business needs.
Data Analytics vs Data Engineering vs Business Intelligence
Data engineering creates the dependable pipelines, storage and data foundations that make information available. Data analytics focuses on interpreting that information, defining metrics, finding patterns and supporting decisions. Business intelligence is often the reporting and analytical delivery layer that turns governed data into dashboards, reports and self-service experiences.
The boundaries overlap in real projects. A dashboard may require data modelling and transformation, while advanced analytics may require engineering and machine learning. We scope each layer according to the actual business problem instead of forcing every requirement into a single category.
If the main problem is unreliable ingestion, disconnected systems or pipeline performance, data engineering is usually the right starting point. If the data is available but teams cannot measure, analyse or act on it effectively, data analytics is the more direct fit.
KPI and Metrics Frameworks
Analytics becomes difficult when the same business concept has multiple definitions. Revenue, active customer, conversion rate, utilization or gross margin can mean different things to different teams unless the calculation, time period, grain and ownership are explicit.
We define KPI frameworks around the decisions they support. A metric can include its formula, dimensions, filters, target, threshold, refresh expectation, owner and source lineage so users understand not only the number but what it means.
A governed KPI framework also reduces dashboard duplication. Instead of every team rebuilding the same metric in separate reports, reusable definitions can support multiple analytical experiences.
Dashboard Development for Executive and Operational Visibility
A useful dashboard should answer a defined set of questions quickly. We design dashboard structures around audience, decision cadence, required context and the actions that follow from changes in performance.
Executive dashboards can focus on strategic KPIs, trends, targets and exceptions. Operational dashboards can provide more granular status, queues, capacity and drilldowns. Departmental dashboards can combine performance metrics with the dimensions that teams control.
We consider filtering, drilldowns, accessibility, loading performance, mobile or large-screen requirements, refresh frequency and permissions so the analytical experience remains useful after launch.
Data Visualization and Reporting Capabilities
Executive Scorecards
High-level KPI views for leadership reviews, strategic planning and performance monitoring.
Trend Analysis
Time-series views that reveal growth, decline, seasonality and changes in business performance.
Drilldown Analysis
Move from summary metrics into products, customers, regions, channels or operational dimensions.
Exception Monitoring
Highlight unusual values, threshold breaches and areas requiring attention.
Comparative Analysis
Compare targets, periods, segments, products, teams and channels using consistent measures.
Automated Reporting
Schedule recurring reports and distribute the right analytical views to the right stakeholders.
Descriptive, Diagnostic and Predictive Analytics
Descriptive analytics explains what happened through summaries, KPIs, trends and reporting. Diagnostic analytics goes further by examining why performance changed across relevant dimensions, cohorts and contributing factors.
Predictive analytics estimates what may happen next using historical data, statistical techniques or machine learning where the data supports a reliable model. Common applications include demand forecasting, churn risk, sales forecasting, anomaly detection and capacity planning.
Advanced analytics should not be added simply because a project can use machine learning. We first establish the decision, available data, expected value and acceptable error before recommending a predictive approach.
Customer, Product and Revenue Analytics
Customer analytics brings together acquisition, engagement, transactions, support interactions and product behavior to understand the customer lifecycle. Teams can segment customers, analyse retention, identify churn signals and evaluate customer value.
For SaaS and digital products, product analytics can connect events, accounts, features, plans and outcomes to understand activation, adoption, retention and expansion.
Revenue analytics connects sales, subscriptions, orders, pricing, discounts and customer segments so leaders can understand not only revenue growth but the drivers behind it.
Marketing and Sales Analytics
Marketing analytics can unify campaign, advertising, website, lead and CRM information to measure acquisition performance and the movement from attention to qualified demand and revenue.
Sales analytics can show pipeline coverage, stage conversion, sales velocity, win rates, deal size, rep performance and forecast movement. The goal is to give sales teams more than a historical report: it should reveal where attention is needed.
Where attribution is complex, we document assumptions and limitations rather than presenting a false level of precision. Analytics should make uncertainty visible when the underlying data cannot support a definitive conclusion.
Operational and Financial Analytics
Financial Analytics
Revenue, cost, margin, cash-flow indicators, budgets, variance and profitability analysis.
Sales Performance
Pipeline, conversion, bookings, revenue contribution, territory and product performance.
Operations Analytics
Throughput, capacity, service levels, productivity, exceptions and process performance.
Supply Chain Analytics
Inventory, fulfillment, procurement, delivery and demand patterns across operations.
Workforce Analytics
Capacity, utilization, staffing patterns, productivity and operational workforce metrics.
Management Reporting
Recurring cross-functional reporting packages with consistent definitions and controlled distribution.
Self-Service Analytics Without Losing Data Trust
Self-service analytics works best when business users have freedom to explore within a governed analytical environment. Without shared definitions and access controls, self-service can create another layer of conflicting reports.
We can establish certified datasets, semantic models, role-based workspaces, reusable metrics and documentation so users can answer common questions while critical definitions remain controlled.
Enablement also matters. Clear naming, training, ownership and support paths help teams adopt analytics instead of returning to spreadsheets or requesting every report from a central data team.
Analytics Integrations and Data Sources
Analytics often depends on information spread across CRM, ERP, commerce, finance, marketing, product, support and operational systems. We connect relevant sources and shape the information into analytical models that can be used consistently.
Common integration patterns include APIs, databases, cloud storage, SaaS connectors, event streams and scheduled files. The right approach depends on freshness, source limitations, volume and operational requirements.
Where data pipelines or warehouse architecture are substantial dependencies, our analytics work can be coordinated with data engineering so the analytical layer is built on maintainable foundations.
Analytics Security, Governance and Access Control
Analytics can expose commercially sensitive, financial, customer and operational information, so access should be designed around roles and business responsibilities.
We can implement role-based access, department or tenant boundaries, controlled workspaces, auditability, data masking where appropriate and environment separation. Sensitive metrics should only be visible to the audiences that need them.
Governance also includes metric ownership, documentation, lineage, refresh expectations and controlled changes. A trusted analytics environment needs people and operating practices as well as technology.
Analytics Architecture and Semantic Models
A practical analytics architecture may include source systems, data pipelines, analytical storage, transformation models, a semantic layer and dashboard or application consumers.
The semantic layer is particularly valuable when many teams need the same concepts. Reusable dimensions, measures, relationships and business rules help dashboards and self-service analysis stay consistent.
Architecture should match the organization's scale. A focused analytics project may need a small number of well-designed models, while a larger enterprise may require domain-specific models, certified datasets, separate workspaces and stronger governance.
Data Analytics Use Cases
Executive KPI Monitoring
Give leadership a consistent view of revenue, growth, profitability, customers and operational health.
Customer 360
Combine customer activity, transactions, support and engagement into a unified analytical view.
Churn & Retention
Identify retention patterns and risk signals to support customer success and product decisions.
Demand Forecasting
Use historical patterns and relevant drivers to support planning and inventory or capacity decisions.
Marketing Performance
Measure campaign, channel, lead and revenue performance across the customer acquisition journey.
Sales Forecasting
Analyse pipeline health, conversion patterns, deal movement and forecast changes.
Operational Monitoring
Track service levels, throughput, capacity, costs and exceptions with timely reporting.
Product Analytics
Understand feature adoption, engagement, activation, retention and usage patterns.
Industries We Support
SaaS & Technology
Product usage, subscriptions, retention, revenue and customer lifecycle analytics.
Retail & E-commerce
Sales, products, inventory, customer, marketing and profitability analytics.
Finance & Fintech
Financial performance, customer behavior, risk indicators and governed reporting.
Healthcare
Operational, service and management analytics with appropriate privacy and access controls.
Logistics & Supply Chain
Delivery, fleet, inventory, fulfillment and operational performance analytics.
Manufacturing
Production, quality, capacity, supply chain and process performance analytics.
Professional Services
Project, resource, utilization, revenue and client performance analytics.
Education
Student engagement, course, enrollment and institutional performance reporting.
Our Data Analytics Development Process
01. Business Discovery — Understand the decisions, users, business goals, current reports and problems the analytics initiative should solve.
02. Analytics Audit — Review available data, dashboards, definitions, quality, refresh patterns, tools and adoption.
03. KPI Definition — Agree on important metrics, formulas, dimensions, owners, targets and business rules.
04. Data Assessment — Map sources, required history, grain, quality limitations, access requirements and analytical dependencies.
05. Analytics Architecture — Define storage, modelling, semantic, reporting and integration layers appropriate to the workload.
06. Data Modeling — Create reusable analytical models, dimensions, measures and transformations that support agreed metrics.
07. Experience Design — Plan dashboard layouts, drilldowns, filters, alerts, user roles and decision workflows.
08. Development & Integration — Build dashboards, reports, models, analytics workflows and required source integrations.
09. Advanced Analysis — Add segmentation, forecasting, anomaly detection or predictive models where the business case supports them.
10. Testing & Validation — Reconcile metrics, test filters and calculations, validate permissions and check performance and refresh behavior.
11. Launch & Enablement — Release analytics assets, document definitions, train users and establish ownership and support paths.
12. Optimization — Improve performance, adoption, analytical coverage and governance as business questions evolve.
Data Analytics Technology Stack
BI & Visualization: Power BI, Tableau, Looker, Looker Studio, Metabase and custom web-based dashboards selected around the users and existing environment.
Data & Modeling: SQL, PostgreSQL, cloud warehouses, analytical databases, dbt and reusable semantic or transformation models.
Cloud Analytics: AWS, Microsoft Azure and Google Cloud services for analytical storage, processing, access and deployment.
Advanced Analytics: Python, pandas, statistical methods and machine learning frameworks for forecasting, segmentation, anomaly detection and predictive use cases.
Integration: REST and GraphQL APIs, SaaS connectors, database integrations, cloud storage and event-driven data sources.
Engineering & Operations: Git, CI/CD, monitoring, logging, access control and infrastructure automation where analytics is part of a larger software platform.
Analytics Modernization
Legacy reporting often grows organically: multiple spreadsheets, duplicated dashboards, manually reconciled exports and reports built around definitions that are no longer clear.
Analytics modernization can rationalize the reporting portfolio, establish shared metrics, migrate legacy reports, improve dashboard performance and introduce governed self-service.
The objective is not to replace every existing report. We prioritize the analytical experiences that matter most and create a maintainable foundation for future reporting.
Scalable Analytics for Growing Data and Users
Analytics performance depends on data volume, query complexity, refresh frequency, dashboard design and the number of concurrent users. A dashboard that works for a small team may need a different architecture as usage grows.
We consider incremental models, appropriate aggregation, query optimization, caching, workload separation and data refresh strategies where they improve the experience.
Cost matters too. Analytical platforms can become expensive through inefficient queries, unnecessary refreshes and duplicated models, so we balance responsiveness with infrastructure and operating cost.
Data Analytics Engagement Models
Analytics Assessment
Review current dashboards, metrics, data, tools and gaps and deliver a prioritized analytics roadmap.
Dashboard & BI Project
Design and build an agreed portfolio of dashboards, reports, KPI views and supporting models.
Analytics Platform Project
Build a broader analytical environment including modelling, semantic layers, integrations and governed reporting.
Advanced Analytics Project
Develop forecasting, anomaly detection, segmentation or predictive solutions around a defined business decision.
Analytics Team Extension
Add analytics engineering, BI, data modelling or dashboard development capacity to an existing team.
Ongoing Analytics Support
Continue dashboard enhancements, metric changes, monitoring, performance work and analytical improvements after launch.
When You Need Data Analytics Services
Data analytics is a strong fit when the business already has useful information but teams struggle to turn it into consistent decisions. Conflicting KPIs, manual reporting, spreadsheet-heavy reviews, limited visibility and slow analysis are common signals.
It is also useful when leadership wants a single performance view, teams need self-service reporting, a product needs embedded analytics, or the organization wants to move from historical reporting toward forecasting and proactive decision support.
If the primary problem is that data cannot be reliably collected, transformed or stored, start with data engineering. If the core requirement is an AI product or autonomous workflow, analytics may be one layer within a broader AI initiative.
Why Build Your Analytics Solution With Axora?
Analytics sits across software applications, databases, cloud infrastructure and business workflows. Axora's broader software engineering background helps us understand the systems producing the data rather than treating analytics as an isolated reporting exercise.
Our experience with Node.js, Python, PostgreSQL, MongoDB, Redis, AWS, Google Cloud, APIs, queues and application development supports analytics projects that need integration with real software products and operational systems.
We focus on clear metrics, maintainable models, useful user experiences and practical engineering. The goal is analytics that people can trust and actually use, not simply a collection of attractive charts.
Our Data Analytics Approach
Decision-First Analytics
Start with the business decision and user workflow before selecting charts, dashboards or tools.
Clear Metric Definitions
Document important metrics so teams know how numbers are calculated and who owns them.
Usable Dashboards
Design analytical experiences around the information users need at the moment of decision.
Governed Self-Service
Give teams analytical flexibility while protecting shared definitions, access and trusted datasets.
Practical Architecture
Use the smallest maintainable architecture that can support current analytical requirements and future growth.
Engineering Integration
Coordinate analytics with APIs, applications, data platforms and cloud infrastructure when required.
Related Services
Services to Support Your Analytics Platform

Data Engineering Company
Build reliable data pipelines, warehouses, lakehouses, integrations, streaming systems, and governed data platforms that turn fragmented business data into trusted foundations for analytics, reporting, automation, and AI.
Learn more
API Development Services
Build secure, scalable, and high-performance Web APIs, custom microservices integrations, and RESTful structures. Enterprise API development company delivering premium connector solutions.
Learn more
Cloud & DevOps Automation
Automate delivery with Kubernetes, Terraform, and GitOps. Improve reliability, time-to-restore, and cloud spend with SRE and FinOps.
Learn moreFrom Our Blog
Data, AI & Analytics Insights
From AI to Super Intelligence (SI): What America’s 2026 Shift Means for Business
America’s 2026 shift from AI toward Super Intelligence (SI) signals a deeper business transition: from AI assistants and chatbots to agents, intelligent workflows, enterprise automation and software built around increasingly capable reasoning systems.
Read articleSaaS Database Architecture: PostgreSQL vs MongoDB
Compare PostgreSQL vs MongoDB for SaaS database architecture, including data modeling, transactions, multi-tenancy, indexing, scaling, security, cost and when a hybrid database makes sense.
Read articleFrequently Asked Questions
Ready to Turn Your Data Into Better Decisions?
Tell us what your teams are trying to measure, where the data lives today and where reporting is falling short. We can help define a practical analytics path.
Ready to Transform Your Business?
Get started with our intelligent digital solutions. Our team is ready to help you unlock the power of AI-driven technology.
Send us a message
Fill out the form below and we'll get back to you within 24 hours
Contact Information
Reach out to us through any of these channels