Business Intelligence Company
Turn fragmented business data into trusted KPIs, interactive dashboards, governed reporting, self-service BI, and decision systems that help leadership and teams act with confidence.
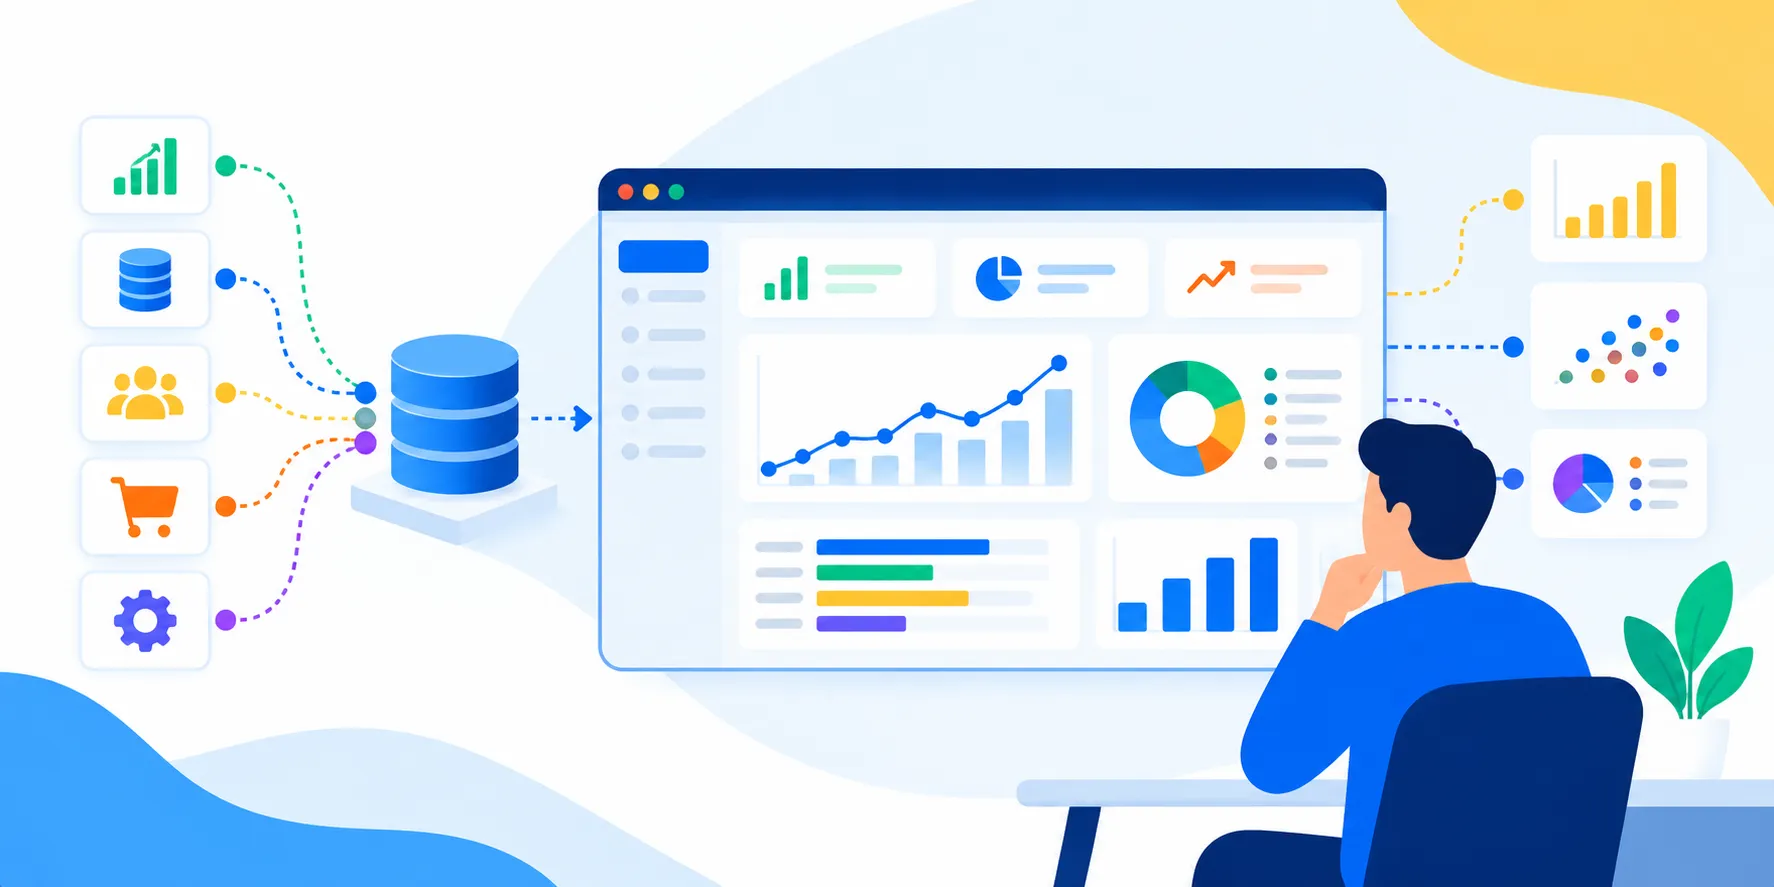
Business Intelligence That Makes Business Data Easier to Use
Business intelligence is most valuable when it helps people answer important business questions quickly. Instead of manually combining spreadsheets, exports, CRM reports, finance files, and operational systems, a governed BI environment brings the right metrics into a consistent reporting layer.
Our business intelligence services cover BI strategy, KPI definition, data modeling, dashboard development, reporting automation, self-service BI, embedded analytics, platform implementation, governance, migration, and ongoing optimization. We design the reporting experience around the decisions your teams need to make.
The result is more than a collection of charts. A useful BI system gives leadership a reliable view of performance, gives operational teams the detail needed to act, and gives business users enough flexibility to explore data without creating conflicting versions of important metrics.
Who We Help
Business Intelligence for Teams That Need Clearer Decisions
We adapt BI solutions to the reporting maturity, data environment, users, and decisions that matter to each organization.
- ✓Leadership TeamsExecutive scorecards, financial visibility, growth metrics, risk indicators, and board-ready reporting.
- ✓Sales OrganizationsPipeline, conversion, territory, quota, customer, revenue, and sales performance reporting.
- ✓Finance TeamsRevenue, margin, cash flow, budget, variance, profitability, and financial performance dashboards.
- ✓Operations TeamsOperational KPIs, service levels, inventory, throughput, exceptions, and process performance.
- ✓Marketing TeamsCampaign, acquisition, channel, funnel, customer, and attribution reporting across data sources.
- ✓Product & Technology TeamsProduct usage, adoption, retention, reliability, feature performance, and operational visibility.
BI Development Services
Business Intelligence Services We Offer
From strategy and platform selection to dashboards, semantic models, governance, and modernization, we build the BI layer around how your business actually operates.
BI Consulting & Strategy
Assess reporting maturity, define BI goals, prioritize use cases, select platforms, and create a practical delivery roadmap.
BI Dashboard Development
Build interactive executive, operational, departmental, and analytical dashboards around real business questions.
Power BI Development
Design Power BI data models, reports, dashboards, measures, workspaces, security, and deployment workflows.
Tableau Development
Create interactive Tableau reporting experiences, governed data views, dashboards, and analytical workflows.
Looker Development
Build governed explores, semantic models, dashboards, and reporting workflows around a centralized metrics layer.
BI Reporting & Executive Dashboards
Replace manual reporting with role-specific KPI views, scorecards, trends, drill-downs, and scheduled reporting.
Self-Service BI
Give business teams controlled access to certified datasets, metrics, filters, and exploration without creating reporting chaos.
Semantic Layer & Metrics Design
Define reusable business metrics, dimensions, relationships, calculation logic, and ownership so numbers stay consistent.
Embedded BI & Analytics
Embed dashboards and analytics inside SaaS products, portals, and internal applications with tenant-aware access.
BI Integration Services
Connect CRM, ERP, databases, commerce, marketing, finance, product, APIs, spreadsheets, and cloud data platforms.
BI Migration & Modernization
Modernize spreadsheet-heavy or legacy reporting environments and migrate reports, models, permissions, and workflows.
BI Governance & Security
Implement access controls, row-level security, workspace governance, certification, lineage, and responsible data access.
BI Performance Optimization
Improve model design, query performance, refresh behavior, dashboard responsiveness, and reporting reliability.
Reporting Automation
Automate scheduled reports, alerts, refreshes, distribution workflows, and recurring management reporting.
Business Intelligence vs Data Analytics vs Data Engineering
Business intelligence, data analytics, and data engineering work together, but they solve different parts of the data problem. Data engineering creates reliable pipelines, warehouses, lakehouses, and data foundations. Data analytics investigates performance, patterns, drivers, forecasts, and opportunities. Business intelligence turns governed data and agreed metrics into reporting systems that people can use repeatedly for decisions.
A company may need all three. For example, data engineering can unify CRM, ERP, product, and finance data; analytics can investigate why customer retention changed; and business intelligence can make the agreed retention definition available through an executive dashboard and governed self-service model.
This separation helps us design the right solution instead of treating every data requirement as another dashboard project.
Metrics Architecture
KPI Frameworks and Trusted Business Metrics
Dashboards are only as trustworthy as the definitions underneath them.
- ✓Metric DefinitionsDocument how revenue, customers, orders, margin, churn, conversion, utilization, and other important measures are calculated.
- ✓KPI HierarchiesConnect company-level outcomes to departmental metrics and operational indicators so teams understand how measures relate.
- ✓Dimensions & FiltersDefine common dimensions such as customer, product, geography, channel, time, and organization consistently.
- ✓Certified MetricsCreate approved metrics and datasets that teams can reuse instead of rebuilding business logic in every report.
- ✓Metric OwnershipEstablish owners, definitions, review rules, and change processes for high-value business metrics.
- ✓ReconciliationValidate important BI numbers against source systems and agreed business rules before they reach decision-makers.
BI Dashboards
Dashboard Development for Executive and Operational Decisions
We design dashboards around audience, decision frequency, information hierarchy, and the actions users need to take.
Executive Dashboards
High-level KPIs, trends, variance, targets, financial performance, growth, and risk indicators.
Operational Dashboards
Live or frequent operational metrics, exceptions, queues, service levels, inventory, and process status.
Department Dashboards
Role-specific views for sales, marketing, finance, HR, customer success, operations, and product teams.
Drill-Down Reporting
Move from summary KPIs into dimensions, transactions, customers, products, regions, teams, and root causes.
Alerts & Scheduled Reports
Deliver recurring reports and notifications when thresholds, exceptions, or important changes require attention.
Mobile BI
Make critical reporting usable across desktop and mobile contexts without overwhelming the user with unnecessary detail.
Semantic Models That Keep BI Numbers Consistent
A governed semantic layer provides a reusable business interpretation of data between raw sources and the reports people consume. Instead of every dashboard defining revenue, active customers, or conversion differently, the model establishes shared definitions and relationships.
We design dimensions, measures, relationships, calculation logic, access rules, and certified datasets around the reporting needs of the business. Depending on the platform, this may involve Power BI semantic models, Tableau data structures, Looker modeling, warehouse-native models, or another suitable approach.
This foundation is especially important for self-service BI. Users can explore data more freely when the underlying definitions, permissions, and data sources are already controlled.
Self-Service Analytics
Governed Self-Service BI Without Losing Control
Self-service should reduce reporting bottlenecks without creating dozens of conflicting versions of the truth.
- ✓Certified DatasetsGive teams trusted data sources that are prepared for common reporting and exploration use cases.
- ✓Role-Based AccessControl which users, teams, departments, tenants, or regions can see particular data.
- ✓Reusable MetricsKeep important calculations in governed models instead of allowing every report to reinvent them.
- ✓Guided ExplorationProvide useful dimensions, filters, naming, documentation, and report patterns for business users.
- ✓Training & AdoptionHelp teams understand how to use dashboards, explore certified data, and interpret important metrics.
- ✓Usage GovernanceReview report usage, ownership, duplication, access, and stale content so the BI environment stays maintainable.
Technology Options
BI Platforms We Work With
The best BI platform depends on your existing ecosystem, users, governance requirements, data architecture, and reporting goals.
Microsoft Power BI
Power BI reports, semantic models, workspaces, security, refresh, deployment, and embedded scenarios.
Tableau
Interactive Tableau dashboards, data exploration, governed reporting, and enterprise visualization workflows.
Looker
Looker dashboards, governed explores, semantic modeling, and analytics experiences built around reusable definitions.
Metabase & Modern BI
Practical reporting and self-service experiences where a lightweight or embedded BI approach fits the organization.
Custom Embedded Analytics
Product-specific analytics interfaces using application-native components when a standalone BI tool is not the right experience.
Cloud Data Platforms
Connect BI to PostgreSQL, BigQuery, Snowflake, Databricks, cloud storage, APIs, warehouses, and other data foundations.
Embedded Business Intelligence Inside Your Product
For SaaS companies and digital platforms, BI does not always belong in a separate analytics portal. Embedded BI can place customer reporting, operational metrics, usage analytics, and account insights directly inside the application where users already work.
We design embedded analytics around authentication, tenant isolation, row-level access, performance, dashboard configuration, white-label requirements, and the product experience. The goal is to make analytics feel like part of the application rather than a separate system.
Embedded BI can also support internal portals, partner dashboards, customer reporting, operational consoles, and role-specific analytics experiences.
Data Sources & Integrations
Connect BI to the Systems That Run Your Business
Business intelligence becomes useful when it combines the systems that hold the context behind business performance.
CRM & Sales Systems
Bring leads, opportunities, accounts, activities, pipeline, conversion, and revenue data together.
ERP & Finance
Connect finance, procurement, inventory, orders, invoices, costs, and operational records.
Commerce Platforms
Analyze products, orders, customers, payments, fulfillment, returns, and commerce performance.
Marketing Platforms
Combine campaigns, channels, acquisition, advertising, web, leads, and customer data.
Product & Application Data
Connect product events, application databases, usage data, subscriptions, support, and engagement signals.
APIs & External Sources
Ingest data from third-party APIs, spreadsheets, files, databases, webhooks, and custom business systems.
Trust & Governance
BI Governance, Security, and Access Control
Governance should make BI safer and more reliable without making it impossible for teams to use.
- ✓Role-Based AccessControl dashboards, datasets, workspaces, and data based on users, teams, roles, or organizational boundaries.
- ✓Row-Level SecurityRestrict data visibility at the row or business-unit level for departments, regions, customers, or tenants.
- ✓Workspace GovernanceStructure development, testing, production, ownership, sharing, and publishing workflows.
- ✓Data LineageImprove visibility into where important metrics originate and which models, reports, and sources depend on them.
- ✓AuditabilityMaintain useful records of access, changes, report ownership, and important governance activities.
- ✓Sensitive Data ControlsApply least privilege, secure connections, environment controls, and appropriate handling for sensitive business data.
A BI Architecture That Connects Data, Models, and Decisions
A dependable business intelligence architecture separates source systems, data ingestion, transformation, modeling, semantic definitions, reporting, and user access while keeping the flow understandable.
A typical architecture may connect operational databases and SaaS platforms into a warehouse or lakehouse, transform and validate the data, publish governed models and metrics, and expose them through dashboards, scheduled reports, self-service tools, or embedded analytics.
The architecture should match the scale and maturity of the organization. We avoid adding unnecessary layers when a simpler approach is sufficient, while keeping clear boundaries so the BI environment can grow as data sources, users, and reporting requirements expand.
Operational Intelligence
Real-Time and Near-Real-Time BI
Some decisions cannot wait for a daily refresh.
Operational Monitoring
Track orders, transactions, service queues, inventory, incidents, and other fast-changing operational signals.
Streaming Metrics
Connect suitable event or streaming sources when dashboards need fresher data than batch reporting provides.
Threshold Alerts
Surface unusual changes or threshold breaches so teams can act before a problem becomes a larger issue.
Near-Real-Time Reporting
Balance freshness, query cost, reliability, and business value rather than forcing every metric into real-time architecture.
What We Build
Business Intelligence Use Cases
We design BI around recurring decisions and measurable business questions.
Executive Performance Reporting
Company-wide revenue, margin, growth, customer, operational, and strategic KPIs.
Sales Performance BI
Pipeline, win rate, conversion, quota, territory, account, and sales forecasting views.
Financial BI
Revenue, expenses, profitability, budget variance, cash flow, and financial reporting.
Customer & Retention BI
Customer health, retention, churn, support, engagement, lifetime value, and account performance.
Marketing BI
Acquisition, campaign, channel, funnel, advertising, attribution, and marketing performance.
Operations BI
Inventory, fulfillment, productivity, service levels, throughput, exceptions, and operational efficiency.
Product BI
Adoption, engagement, retention, feature usage, subscriptions, and product performance.
Embedded Customer Analytics
Customer-facing reporting inside SaaS products, portals, and partner applications.
Industry Use Cases
Business Intelligence Across Industries
The metrics and reporting model should reflect how each industry actually operates.
SaaS & Technology
MRR, ARR, churn, retention, product usage, acquisition, expansion, and customer health.
Retail & E-commerce
Orders, products, inventory, conversion, customer behavior, returns, margins, and sales performance.
Manufacturing
Production, quality, downtime, inventory, procurement, throughput, and operational performance.
Logistics & Transportation
Fleet, delivery, routes, service levels, costs, utilization, and operational exceptions.
Healthcare
Operational reporting, scheduling, service metrics, resource utilization, and secure reporting workflows.
Financial Services
Portfolio, revenue, risk, customer, compliance, and operational reporting with strong access controls.
Professional Services
Projects, utilization, revenue, margins, resource allocation, pipeline, and client reporting.
Education
Enrollment, learner engagement, performance, operations, finance, and institutional reporting.
Our Business Intelligence Development Process
We move from business decisions to trusted metrics, models, dashboards, validation, adoption, and continuous improvement.
Business & Reporting Discovery
Understand business goals, decisions, current reports, stakeholders, pain points, data sources, and reporting priorities.
KPI & Metric Alignment
Define important metrics, dimensions, calculation rules, ownership, targets, and reporting expectations.
Data Landscape Assessment
Review source systems, data quality, availability, refresh requirements, integrations, and existing models.
BI Architecture & Platform Strategy
Select suitable BI tools, data architecture, semantic approach, security model, environments, and delivery plan.
Data Modeling & Preparation
Prepare reliable datasets, relationships, transformations, dimensions, measures, and reusable reporting structures.
Semantic Model & Governance
Implement shared metrics, access rules, certified datasets, naming, ownership, and governance foundations.
Dashboard & Report Development
Design executive, operational, departmental, self-service, or embedded reporting experiences around user workflows.
Validation & Reconciliation
Validate calculations, reconcile important metrics to source systems, test filters and access, and resolve data discrepancies.
Performance & Security Testing
Test model performance, refresh behavior, dashboard responsiveness, permissions, row-level security, and operational reliability.
User Acceptance & Training
Review dashboards with real users, refine the experience, document key metrics, and train teams on governed self-service.
Production Rollout
Deploy the BI environment, establish refresh and monitoring routines, publish approved content, and manage access.
Continuous BI Improvement
Improve reports, models, performance, governance, adoption, new metrics, and reporting coverage as business needs change.
Technology Stack for Business Intelligence
We choose tools around your existing ecosystem, data maturity, user needs, and long-term operating model.
BI Modernization and Migration
Many organizations still depend on spreadsheets, manually assembled reports, duplicated dashboards, legacy reporting tools, or BI environments that grew without clear governance. Modernization does not have to mean replacing everything at once.
We assess existing reports, data models, refresh processes, permissions, source systems, user workflows, and technical constraints. From there, we prioritize high-value migrations and introduce modern dashboards, governed models, automated reporting, stronger access controls, and more maintainable BI practices.
A staged approach can preserve important reporting while moving teams toward a more reliable BI environment. The objective is not simply a new tool; it is a reporting system that people can trust and maintain.
Flexible Delivery
Business Intelligence Engagement Models
Choose the model that fits your reporting roadmap, internal team, and BI maturity.
BI Strategy & Assessment
Assess your current BI environment, reporting gaps, data foundation, tool choices, and roadmap before major implementation.
End-to-End BI Development
One team handles KPI alignment, modeling, dashboards, governance, testing, rollout, and ongoing improvement.
Dedicated BI Team
Add BI engineering, dashboard, data modeling, and analytics capacity around your existing roadmap.
BI Modernization
Improve or migrate an existing reporting environment while continuing to support business-critical reporting.
When Business Intelligence Development Is the Right Investment
Business intelligence becomes a strong investment when important decisions depend on information that is fragmented, delayed, manually assembled, difficult to reconcile, or inaccessible to the people who need it.
It is especially useful when leadership receives different numbers from different teams, recurring reports require spreadsheet work, operational teams cannot see current performance, analysts spend too much time producing repetitive dashboards, or customers need analytics inside a digital product.
The right starting point is usually not 'Which BI tool should we buy?' It is 'Which decisions matter, which metrics support them, who needs the information, and what data must be trusted for those decisions?' The platform and architecture can then follow those requirements.
Why Axora Infotech
Why Businesses Choose Axora for Business Intelligence
We connect BI delivery with data engineering, application development, APIs, cloud, and product engineering so reporting does not become an isolated layer.
- ✓Business-First BIStart with decisions, KPIs, users, workflows, and outcomes instead of building dashboards simply because data is available.
- ✓Engineering + BIConnect reporting with data pipelines, databases, APIs, applications, integrations, and cloud infrastructure.
- ✓Governed MetricsBuild reusable definitions and controlled datasets so important numbers remain consistent across reports.
- ✓Practical ArchitectureUse the simplest architecture that satisfies reporting, governance, performance, and growth requirements.
- ✓Incremental DeliveryPrioritize valuable dashboards and reporting workflows so teams can start using BI while the broader platform evolves.
- ✓Long-Term ImprovementContinue with optimization, new metrics, governance, adoption, integrations, modernization, and platform improvements.
Business Intelligence as an Operating Capability
A successful BI implementation should become part of how the business operates, not another software project that is forgotten after launch. The most valuable BI environments have clear metric definitions, accountable owners, trusted data sources, useful dashboards, and a process for improving reporting as the organization changes.
Our approach connects business intelligence with the engineering layers underneath it. When a KPI depends on a CRM, ERP, application database, API, warehouse, or operational process, the reporting solution has to understand those dependencies.
That perspective helps us build BI environments that are easier to extend, troubleshoot, govern, and connect to the wider software ecosystem.
Related Services
Services to Strengthen Your BI Foundation

Data Engineering Company
Build reliable data pipelines, warehouses, lakehouses, integrations, streaming systems, and governed data platforms that turn fragmented business data into trusted foundations for analytics, reporting, automation, and AI.
Learn more
Data Analytics Company
Turn business data into trusted metrics, interactive dashboards, actionable insights, forecasts, and decision-support systems with data analytics services built around the questions your teams need to answer.
Learn more
API Development Services
Build secure, scalable, and high-performance Web APIs, custom microservices integrations, and RESTful structures. Enterprise API development company delivering premium connector solutions.
Learn more
Cloud & DevOps Automation
Automate delivery with Kubernetes, Terraform, and GitOps. Improve reliability, time-to-restore, and cloud spend with SRE and FinOps.
Learn moreFrom Our Blog
Data, Analytics & AI Insights
Frequently Asked Questions
Ready to Transform Your Business?
Get started with our intelligent digital solutions. Our team is ready to help you unlock the power of AI-driven technology.
Send us a message
Fill out the form below and we'll get back to you within 24 hours
Contact Information
Reach out to us through any of these channels